
This article delves into the 2024 LoL Championship player statistics, uncovering key relationships between player roles, performance metrics, and win rates. Metrics like CS per minute, KDA, gold per minute, and early game statistics are analyzed to provide a deeper understanding of player roles and strategic dynamics. The analysis also highlights the influence of flash keybind preferences and team performance, offering a comprehensive view of trends across roles and regions in the championship.
About Dataset
This dataset contains comprehensive player statistics from the 2024 League of Legends World Championship, focusing on in-game performance and strategic metrics. Key player stats include traditional performance measures (e.g., KDA, win rate) as well as advanced metrics such as vision score per minute (VSPM), wards placed per minute (WPM), and gold differential at 15 minutes (GD@15). Each row represents an individual player’s performance throughout the tournament, providing insights into their strategic impact and in-game efficiency.
Dataset source: Kaggle
Given the dataset, ChatElite AI detects and analyzes the metadata, then gives these relevant inquiries:
How does the average CS per minute differ among the various player positions?
Average CS Per Minute by Player Position
Analysis of Average CS Per Minute
- Adc: The highest average CS per minute at 9.73, indicating a strong focus on farming.
- Mid: Follows with an average of 8.68, reflecting a balance between farming and other roles.
- Top: Has an average of 7.81, showing a moderate focus on farming.
- Jungle: Lower average at 5.98, as junglers often focus on objectives and ganking.
- Support: The lowest average CS per minute at 1.13, as their role is more about assisting teammates.
Visualization of Differences
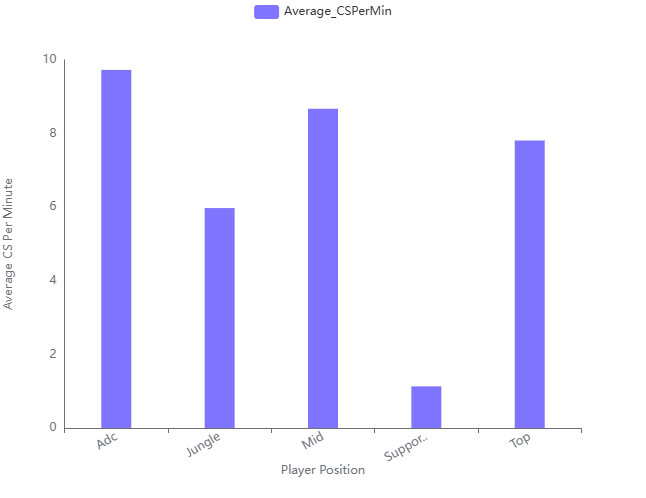
The bar chart visually confirms that Adc players have the highest CS per minute, while Support players have the lowest.
Conclusion and Insights
- Role Alignment: The CS per minute aligns with the typical responsibilities of each position, with Adc focusing on farming and Support on team assistance.
- Strategic Implications: Teams may prioritize farming strategies for Adc and Mid positions to maximize damage output.
What is the relationship between the player’s position and their average KDA?
Relationship Between Player Position and Average KDA
Average KDA by Position
- Adc (Attack Damage Carry): Highest average KDA at 4.81. ADCs are primary damage dealers, focusing on maximizing kills while minimizing deaths.
- Mid: Second highest average KDA at 4.12. Mid laners are high-impact players, central to team fights and skirmishes.
- Jungle: Average KDA of 3.72. Junglers roam the map, assisting lanes and securing kills, crucial for setting up plays.
- Support: Average KDA of 3.11. Supports focus on assisting teammates, often having high assist numbers rather than kills.
- Top: Lowest average KDA at 3.07. Top players balance dealing and absorbing damage, engaging in both offensive and defensive plays.
Visualization Insights
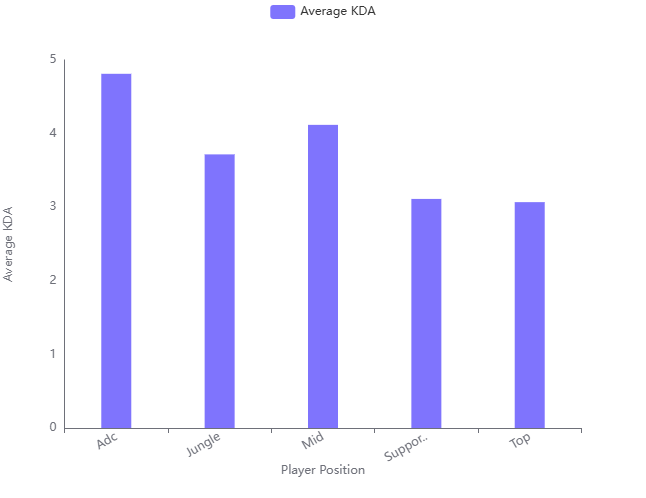
- The bar chart visually confirms that ADCs and Mid laners have the highest average KDAs, reflecting their roles as primary damage dealers.
- Supports and Top players have lower KDAs, aligning with their roles in assisting and absorbing damage.
Conclusion and Insights
- Role Impact: Positions focusing on damage (Adc, Mid) generally have higher KDAs, while support roles (Support, Top) have lower KDAs but contribute significantly through assists.
- Strategic Importance: Understanding these dynamics can help teams optimize player roles and strategies based on KDA performance.
What is the impact of the flash keybind preference on the player’s performance metrics like KDA and win rate?
Effect of Preferred Flash Keybind on Player Performance Metrics
Average KDA and Win Rate Analysis
- FlashKeybind ‘D’:
- Average KDA: 3.27
- Average Win Rate: 0.42
- FlashKeybind ‘F’:
- Average KDA: 4.36
- Average Win Rate: 0.50
Visual Comparison
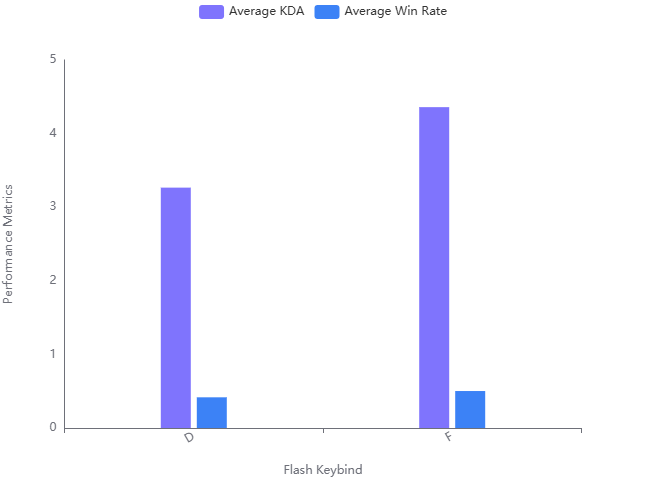
- Performance Metrics Visualization:
- The bar chart shows that players using the ‘F’ keybind have higher average KDA and win rate compared to those using ‘D’.
Conclusion and Insights
- Higher Performance with ‘F’ Keybind: Players using the ‘F’ keybind tend to have better performance metrics, with both higher average KDA and win rate.
- Potential Correlation: While there is a noticeable difference, it’s important to consider other factors that might influence these metrics, as correlation does not imply causation.
Are there any noticeable patterns in the gold per minute for players with high KDA?
Patterns in Gold Per Minute for High KDA Players
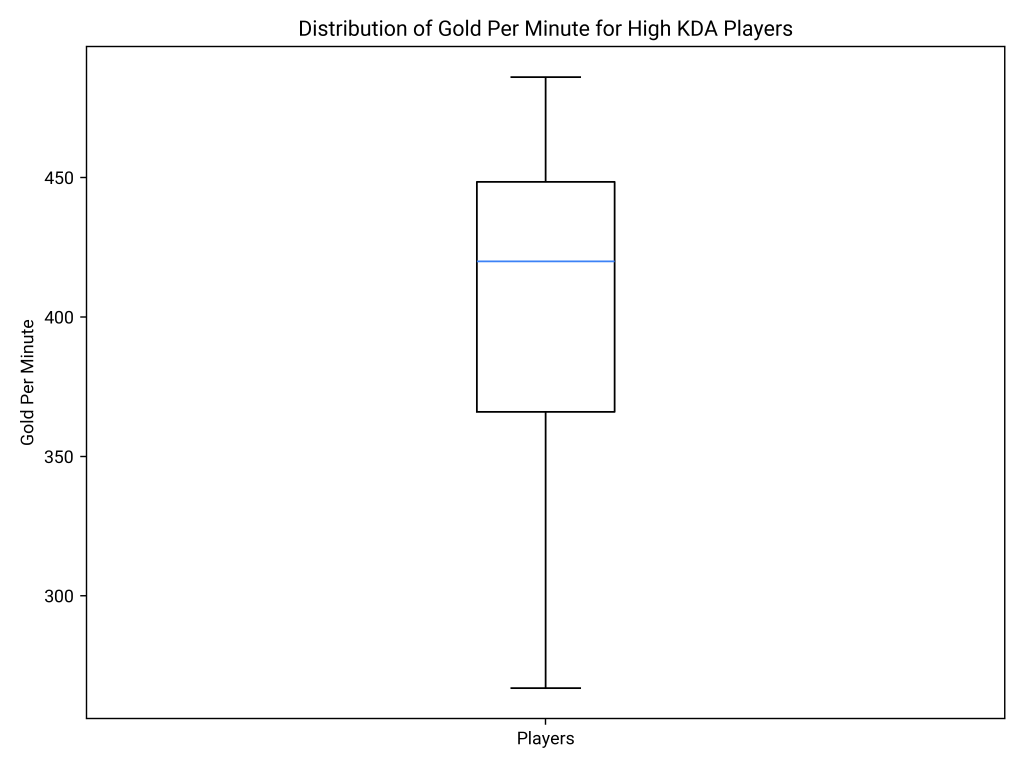
High GoldPerMin
- High GoldPerMin: Players with a high KDA generally have a GoldPerMin above 400, indicating a strong correlation between high performance in kills, deaths, and assists and rapid gold accumulation.
Role Influence
- Role Influence: Many high KDA players are ADCs or Mid laners, roles that typically secure more gold due to their central role in dealing damage and securing kills.
Team Success
- Team Success: Players from successful teams like T1 and Gen.G frequently appear, suggesting that team performance contributes to individual success in both KDA and GoldPerMin.
Consistency Across Regions
- Consistency Across Regions: High KDA and GoldPerMin are observed across different regions, indicating these metrics are universally indicative of strong player performance.
Conclusion and Insights
- Key Insight: High KDA players tend to have a high GoldPerMin, often exceeding 400, and are typically in roles or teams that facilitate high gold income.
- Universal Pattern: This pattern is consistent across various teams and regions, highlighting the importance of both individual skill and team dynamics in achieving high performance.
How do the early game metrics (GD@15, CSD@15, XPD@15) influence the overall win rate of a player?
Influence of Early Game Metrics on Win Rate
Correlation Analysis
- GD@15 Correlation: The correlation between GD@15 and win rate is 0.586, indicating a moderate positive relationship. This suggests that a higher gold difference at 15 minutes is associated with a higher win rate.
- CSD@15 Correlation: The correlation between CSD@15 and win rate is 0.315, showing a weak positive relationship. This implies that a higher creep score difference at 15 minutes has a smaller impact on win rate compared to GD@15.
- XPD@15 Correlation: The correlation between XPD@15 and win rate is 0.320, also indicating a weak positive relationship. This suggests that experience point difference at 15 minutes has a similar impact on win rate as CSD@15.
Significance Testing
- GD@15 Significance: The t-statistic for GD@15 is 4.30 with a p-value of 0.000068, indicating a statistically significant influence on win rate. This confirms that GD@15 is a strong predictor of win rate.
- CSD@15 Significance: The t-statistic for CSD@15 is 1.56 with a p-value of 0.125, suggesting that CSD@15 is not statistically significant in predicting win rate.
- XPD@15 Significance: The t-statistic for XPD@15 is 1.72 with a p-value of 0.091, indicating that XPD@15 is not statistically significant in predicting win rate.
Conclusion and Insights
- GD@15 as a Key Metric: GD@15 has a significant positive correlation with win rate and is statistically significant, making it a crucial early game metric for predicting a player’s success.
- CSD@15 and XPD@15 Limited Influence: Both CSD@15 and XPD@15 show weak correlations with win rate and are not statistically significant, suggesting they have limited influence on a player’s overall win rate compared to GD@15.
Try ChatElite AI Now!
ChatElite AI is a no-code SaaS platform that enables data analysis through natural language interaction. It can analyze over 1,000 files simultaneously, supporting SQL, PDFs, CSVs, and Excel, delivering insights with references for transparency. Features include advanced visualizations, automated reports, and intelligent question suggestions to enhance understanding and uncover new perspectives. If you want to know more about ChatElite AI, please visit: Transform Dormant Data into Actionable Insights with AI